The playground
The flight report
When a flight ends, the simulator writes down what happened: the outcome, the score and why, every landing, and the descent that decided it.
Every flight ends with a report. It is read once from the finished simulation, so nothing in it is an estimate: the objectives are the ones the mission set, the figures are the ones the vehicle flew, and the landings are measured where the legs met the ground.
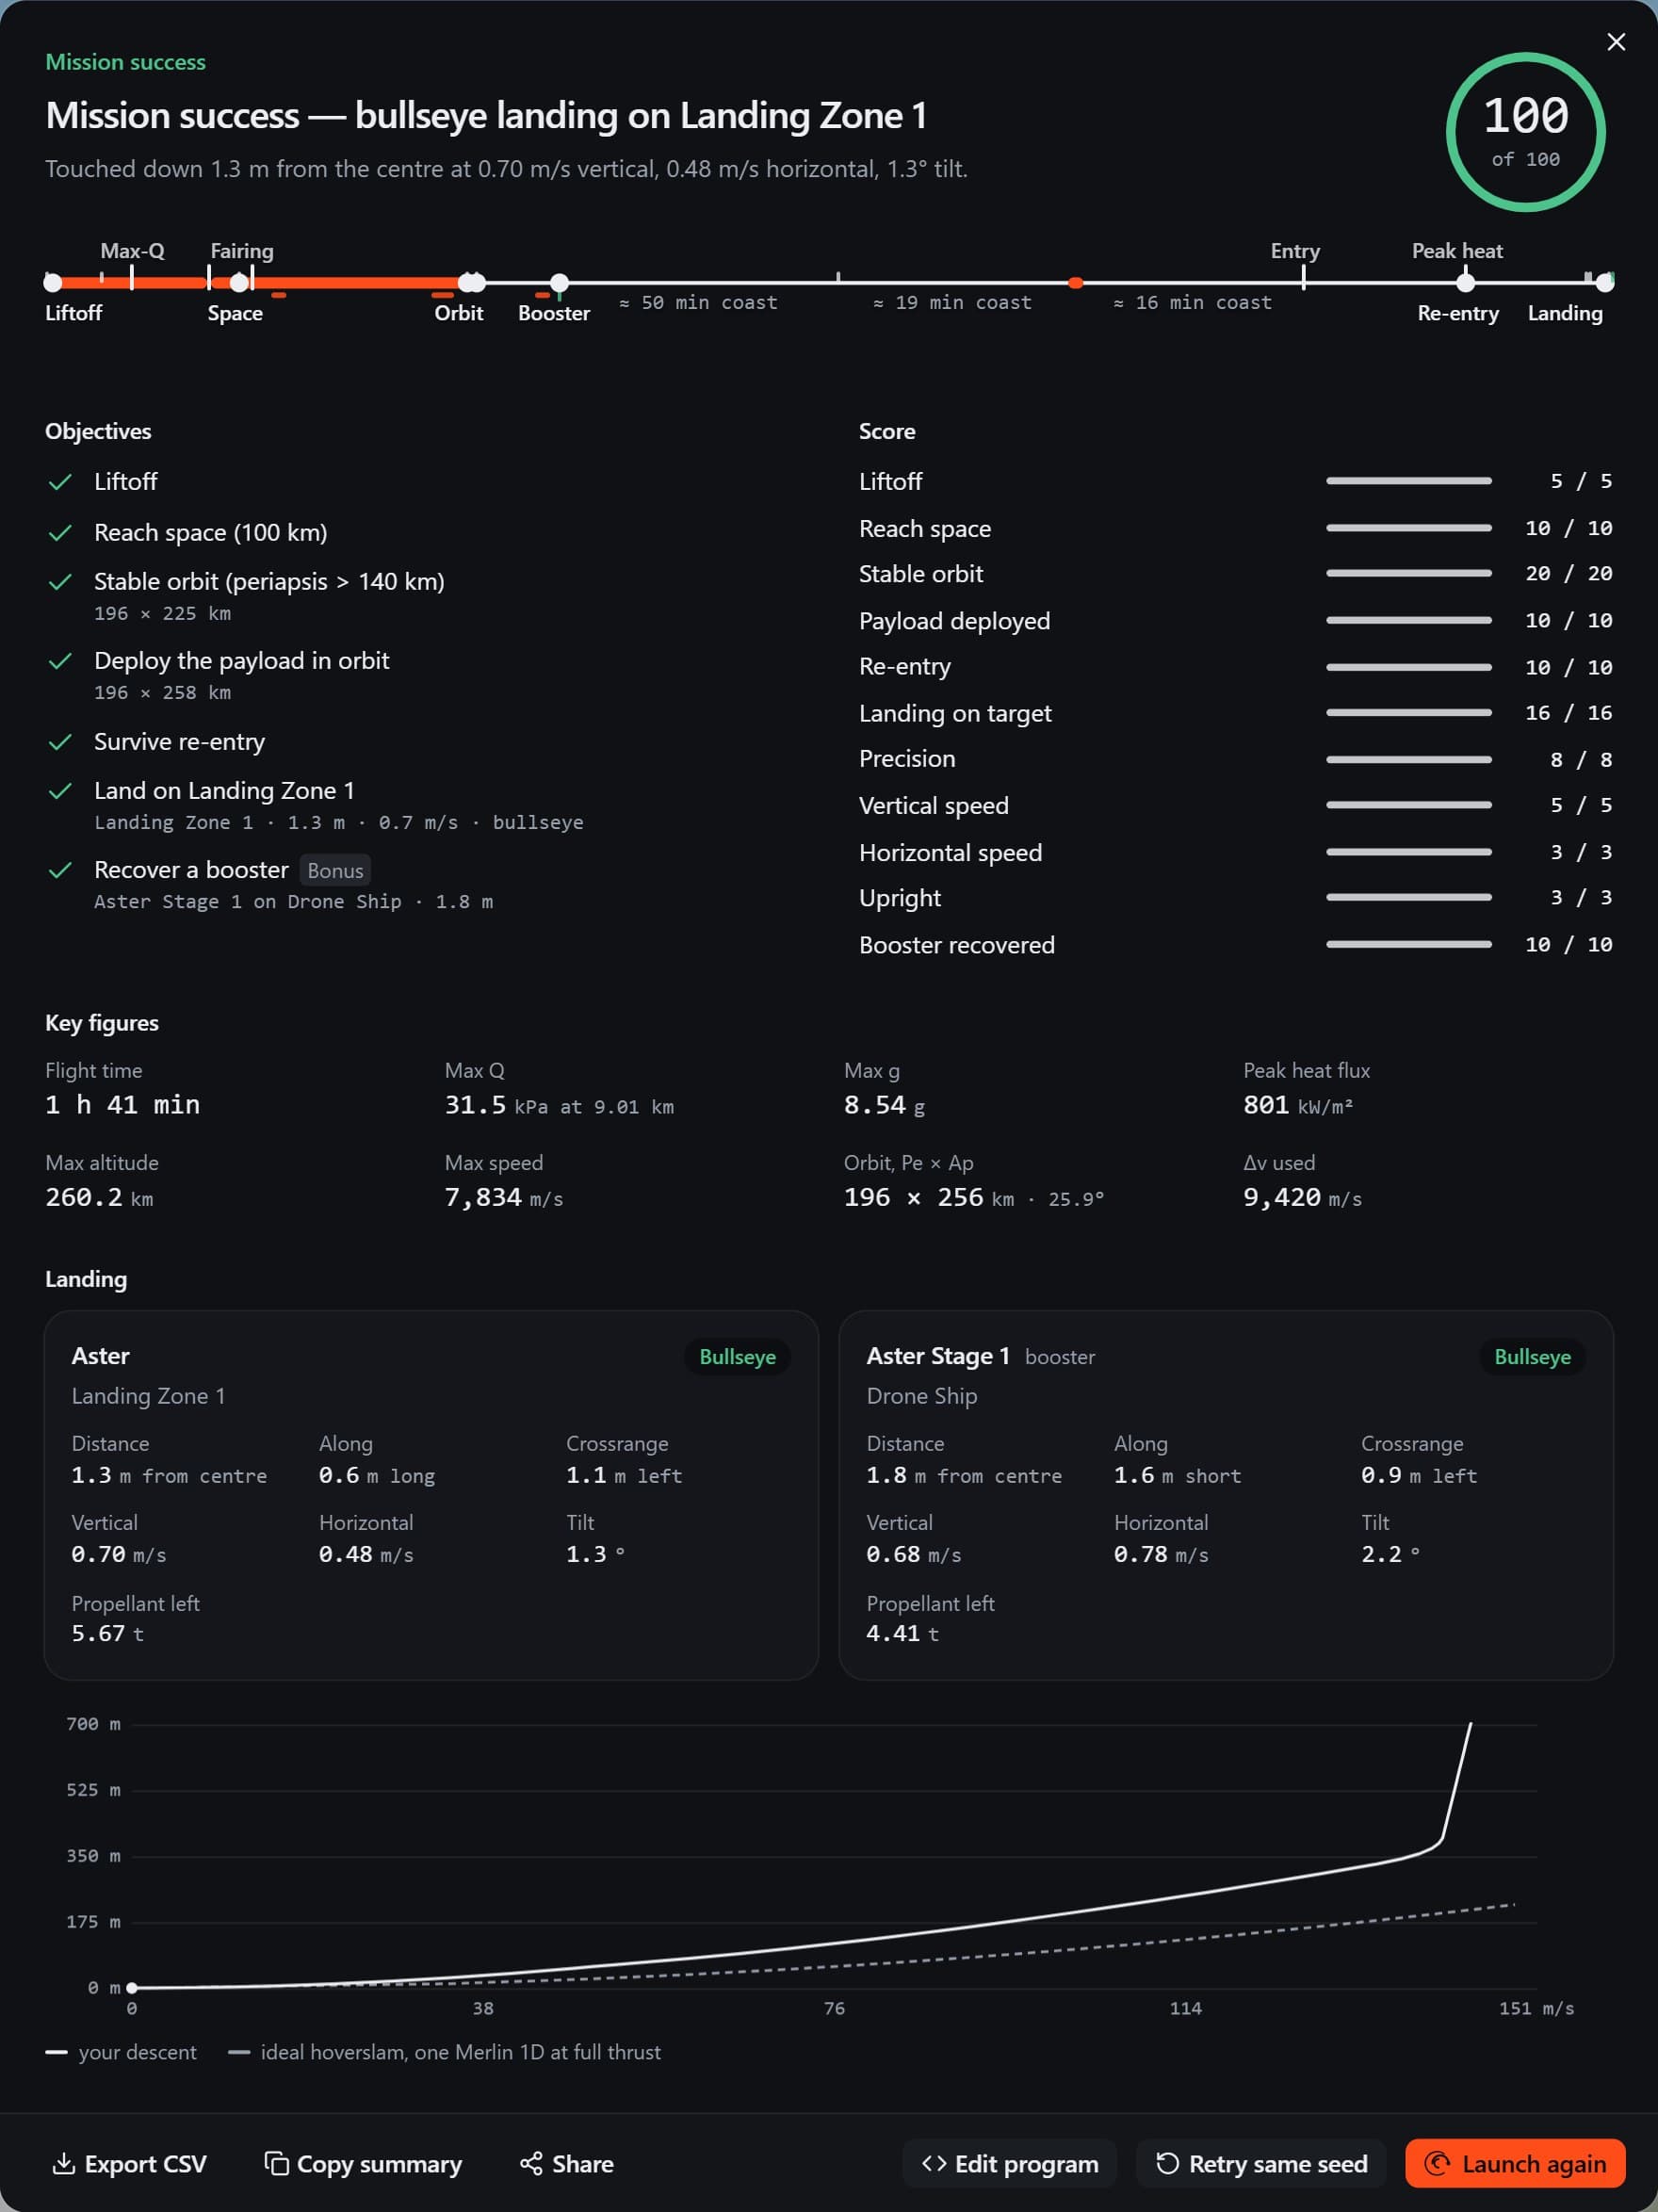
- 1The outcome.
- 2The headline, and the reason under it.
- 3The score, out of 100.
- 4The flight's timeline, start to end.
- 5The mission's objectives.
- 6Where the score came from.
- 7Key figures.
- 8A card for every rocket that came down.
- 9The landing plot: the descent, from just above the burn.
- 10What to do next.
When it appears
A flight ends when the main vehicle has landed and stood still — once any booster still in the air has come down, or had half an hour to — when it is lost, or when nothing more can happen — stranded in orbit with its program stopped, or still flying after eight hours of mission time. The top bar's status turns to Mission success, Partial success or Mission failure, the console notes the headline and the score, and 1.2 s later the report opens over the flight.
If you are typing when the flight ends — in the editor, say — the report does not jump in front of you: a toast says Open the flight report from the top bar instead. Closing the report, with Esc or its cross, leaves the flight where it ended. The chip it leaves in the top bar, its icon coloured by the outcome, opens it again, and so does Open the flight report in the command palette.

The outcome and the score
The top of the report is the verdict. The first line is the outcome in its colour; the headline under it says what happened in one sentence, and the line under that gives the numbers behind it. The ring on the right is the score.
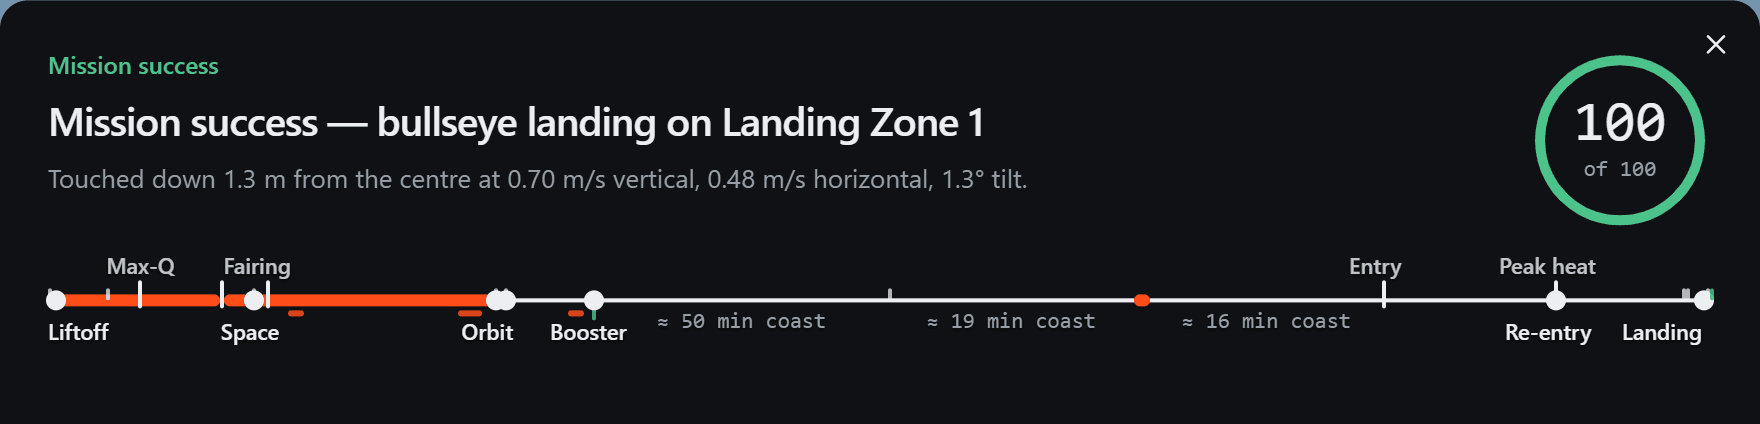
For a flight to Earth orbit or a hop, the outcome follows simple rules:
- Mission success: the main vehicle landed on its target, and reached a stable orbit — or, on a hop, the hop altitude. On a return-to-launch-site mission the booster has to be back too.
- Partial success: it came down in one piece but not the way it was asked to — on the wrong platform, off the platforms, without having reached orbit — or it is coasting in orbit with its program stopped after deploying the payload, or it was still flying after eight hours.
- Mission failure: the vehicle was lost, or it is stranded in orbit without having deployed the payload.
When the main vehicle was lost, a Why? under the headline opens the loss report: what failed, the numbers against the limit it broke, one thing to try, and, when your program was at fault, a button that shows the line in the editor.
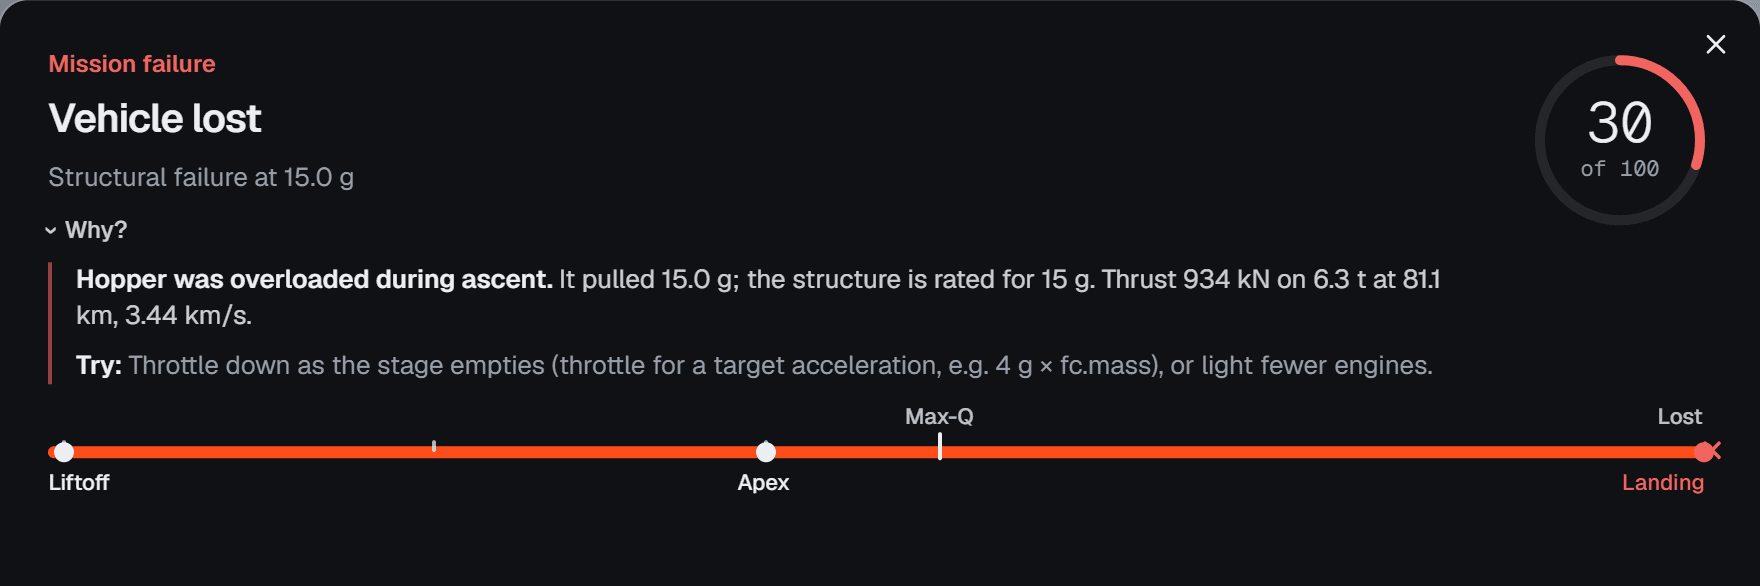
The timeline under the head is the one that ran across the top of the flight view, redrawn for the whole flight: the milestones in order — filled when done, red when failed, hollow when never reached — the burns in orange, separated boosters on a thinner lane underneath, long coasts shortened and labelled with their length, and a loss marked where it happened.
Objectives and score
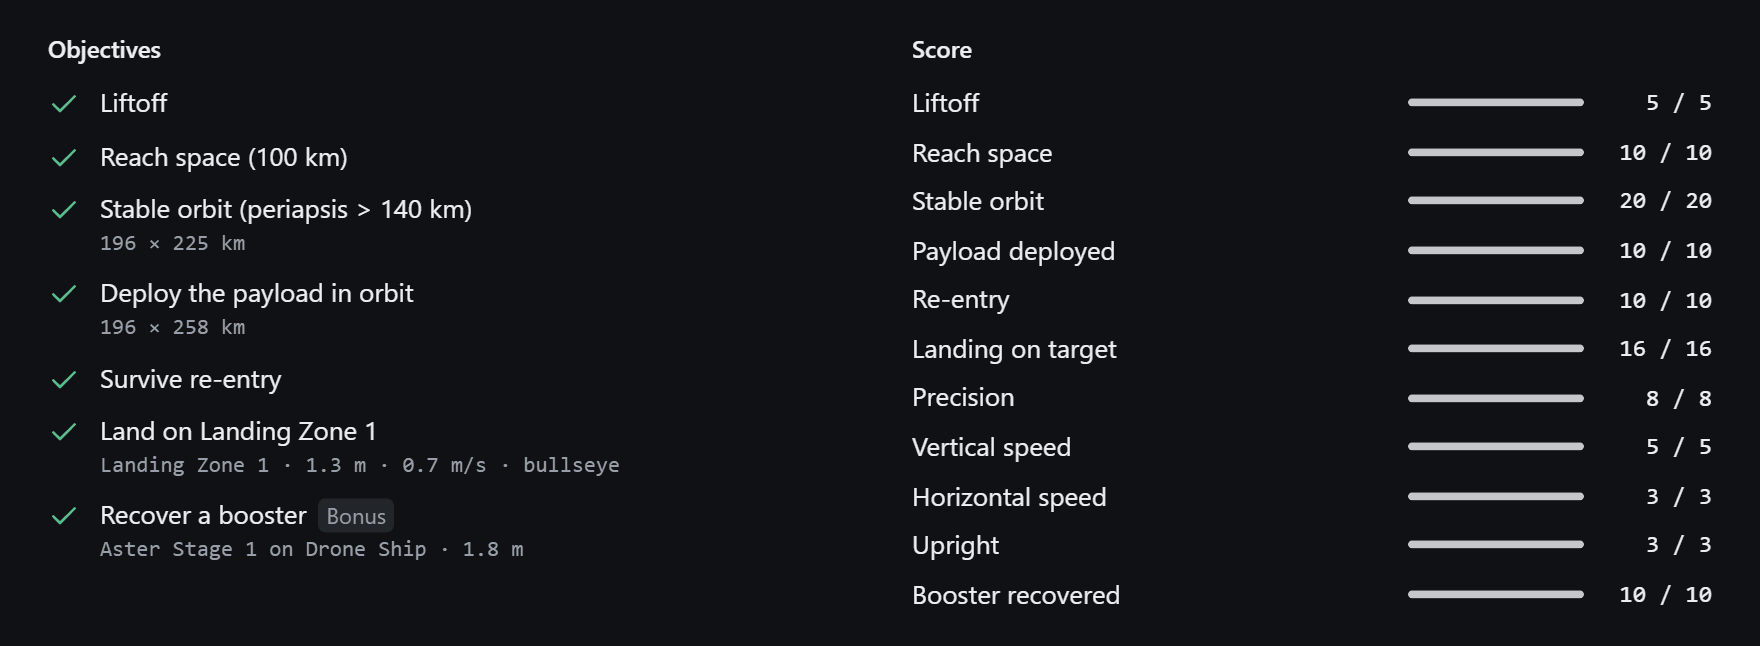
The objectives are what the mission profile asked for, each ticked, crossed, or left grey when it was never reached or not attempted, with the number that settled it underneath. The score breaks the 100 points down, each row with its points against its maximum. For an orbital flight:
| Row | Points | How they are earned |
|---|---|---|
| Liftoff | 5 | Leaving the pad |
| Reach space | 10 | Passing 100 km |
| Stable orbit | 20 | A periapsis above 140 km |
| Payload deployed | 10 | Released in orbit |
| Re-entry | 10 | Surviving it |
| Landing on target | 16 | 16 on the target platform, 8 on another, 4 off the platforms |
| Precision | 8 | Full at the centre, nothing at 40 m |
| Vertical speed | 5 | Full at 1 m/s or less, nothing at 3 m/s; reduced by any use of the crush cores |
| Horizontal speed | 3 | Full at 0.5 m/s or less, nothing at 2.5 m/s |
| Upright | 3 | Full within 3° of vertical, nothing at 10° |
| Booster recovered | 10 | 10 for a booster on its own target, 5 on another platform |
A hop is scored on its own ten-point liftoff, twenty for reaching the hop altitude, and the landing weighted more heavily — thirty for the target, sixteen for precision, ten, seven and seven for the speeds and the tilt. The total is capped at 100. Coming back down explains how a landing is graded before it is scored.
Key figures

Flight time, maximum dynamic pressure and the height it came at, the highest g-load, the peak heat flux, the highest altitude and speed, the orbit as periapsis by apoapsis with its inclination, and the Δv the vehicle actually spent. Against the budget in the workbench, the last one is a check on the design: Aster flew this mission on 9,420 m/s of its 11,110.
Landings
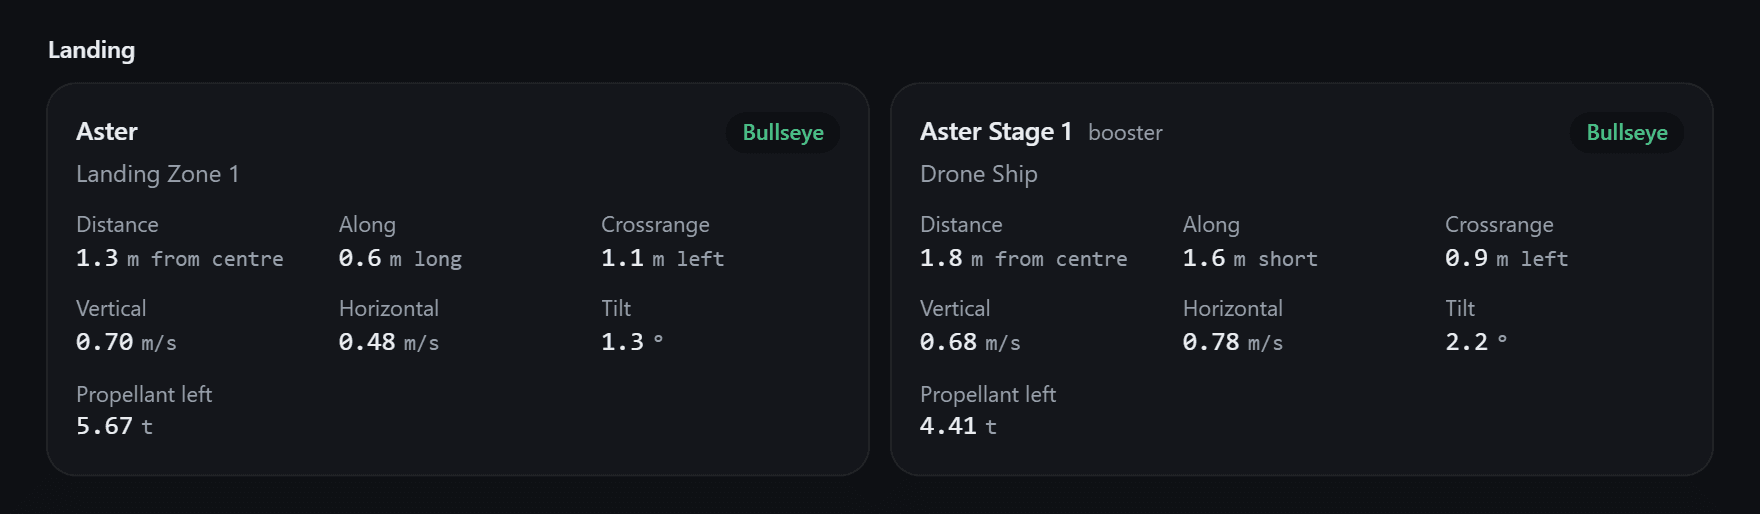
There is a card for the main vehicle and one for every stage that separated from it. A stage that landed shows where, its grade in the corner — Bullseye, Good, Nominal or Hard — and the numbers the grade came from:
- Distance from the centre of the platform, split into along (long or short, in the direction it was flying) and crossrange (left or right).
- Vertical and horizontal speed at touchdown, and the tilt.
- Crush, when the legs' crush cores were used: how much of their stroke. Any crush makes the landing Hard, and a note under the cards says the legs need replacing.
- Propellant left in the tanks.
A stage that was lost says how, and has its own Why?. A stage that was never meant to come back — no legs, or expended on purpose by its program — is marked Expended, and one that was still in the air when the mission ended says so. Notes under the cards list any hardware failures of the flight, and whether it flew noisy sensors.
The landing plot
The plot is the main vehicle's last descent below 2.5 km, drawn as speed against height: the horizontal axis is how fast it was falling, the vertical axis how high it was above the surface it landed on.
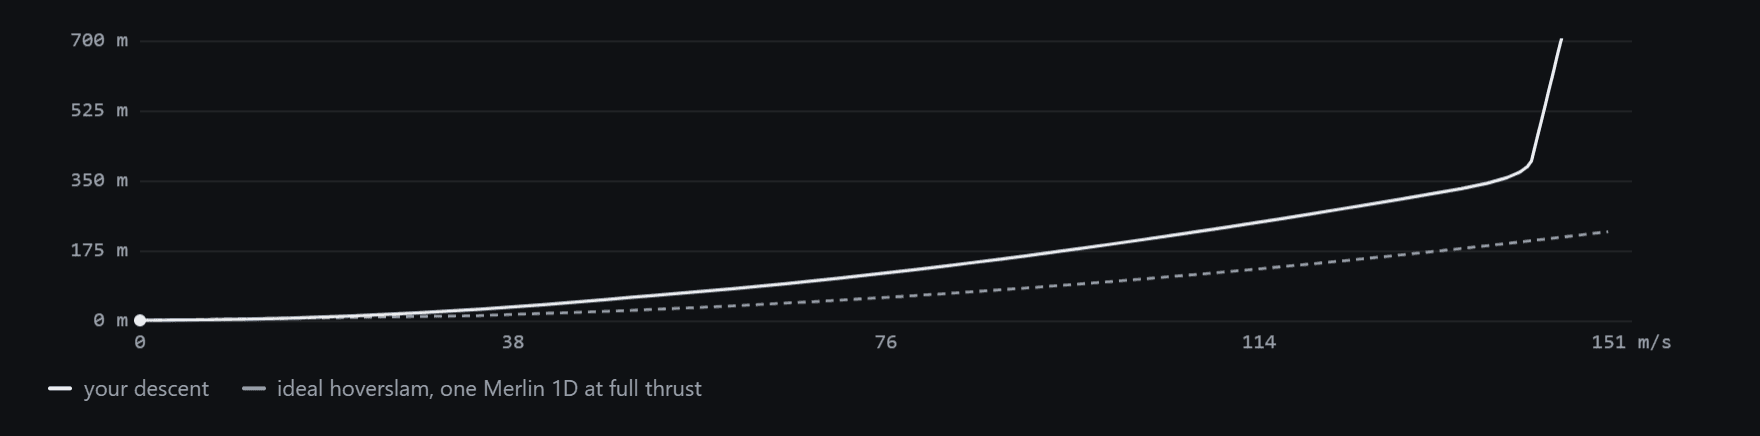
The white line is your descent. The grey dashed curve is the ideal hoverslam for the landing engine at full thrust: the speed from which that engine, lit at that height, would stop the stage exactly at the ground,
with the engine's thrust, the stage's empty mass plus the propellant it landed with, and the gravity of the body it landed on. On a stage with several engines that can fire at sea level, a dotted curve in blue does the same for all of them together. On the Moon, with no air, the curves use the engines' vacuum thrust.
Read it from the top down. While the engine is off, the line drops almost straight, the speed barely changing. The bend is ignition. From there, the line should stay above the grey curve: at every height, falling slower than one engine at full thrust could still stop. Where it crosses below, the stage was falling too fast for one engine to stop it before the ground — it needed more engines, or an earlier burn — and a line that ends away from zero speed at zero height hit the ground moving.
The height axis stops a little above the ignition, so the burn — a few hundred metres at most — fills the plot, and the fall above it leaves through the top edge. A descent that was already braking higher up, or one that never braked, is drawn over the whole 2.5 km. Coming back down is the theory behind the curve.
Missions to the Moon and Mars
A flight that left the Earth is judged on where it went. The report adds a line under the headline saying what the arrival achieved — flew past, captured into orbit, landed, or reached the body but did not capture — and, in red, whether the vehicle was lost there, down to Hit the Moon. The key figures gain the destination, the closest approach and when it came, the orbit about the body once captured, and the length of the transfer.
A Transfer table sets what was flown against the launch window that was planned: the injection Δv, the course corrections, the arrival Δv, their total, and the time of flight, each with the difference. The time of flight runs from the injection burn to the closest approach, the instant the window plans for; a capture or a landing records no such instant, so only the plan is shown. A last row gives the cruise alone, from the injection to the sphere of influence. Within 5 % of the plan a difference is green; beyond 20 % it is amber. The Landing section is headed Arrival, and the score rows change to match: a parking orbit, the injection, reaching the body's sphere of influence, and then the closest approach, the capture or the landing, depending on what the mission asked for. Missions and destinations describes each stage of such a flight.
What next

- Launch again flies the same vehicle, program and mission once more. Unless the weather seed is locked, it rolls a new seed: new weather, new ±1–2 % scatter on the engines and tanks, new random failures if they are on.
- Retry same seed flies it again on the seed this flight used. Its tooltip gives the number. Weather, dispersions and failures are then exactly the same as before, so if you have changed the program, any difference in the result is the program's doing. The command palette has it too, as Retry the same seed.
- Edit program closes the report and puts the cursor in the editor.
- Share opens the share dialog; Export CSV saves the flight recorder's samples for the vehicle in focus.
- Copy summary puts a few lines of plain text on the clipboard, for a note or a message:
Vivapse — Mission success — bullseye landing on Landing Zone 1 — score 100/100
Vehicle: Aster · from Starbase, Texas · seed 7
Landing: Landing Zone 1, 1.3 m from centre, 0.7 m/s vertical, 0.5 m/s horizontal, Bullseye
Booster: Drone Ship, 1.8 m from centre, Bullseye
Flight time 1 h 41 min · max Q 31.5 kPa · orbit 196 × 256 km · 25.9° · Δv used 9,420 m/s
To lock the seed — so that Launch again always flies the same conditions — use Lock the weather seed in the command palette, or the weather settings in the Mission panel. The telemetry of the flight you just flew stays in Details until the next launch: the charts and the console are often the quickest way to find the second where it went wrong.